


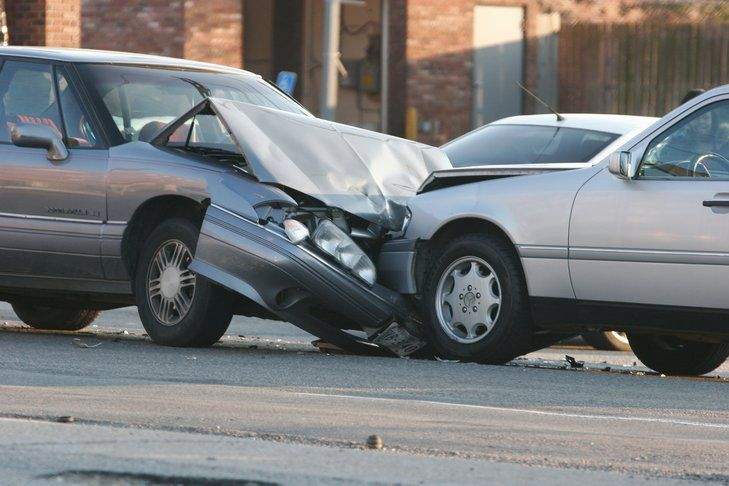
Driving is one of the most common activities in everyday life, but it’s also one of the riskiest. According to data from the National Highway Traffic Safety Administration, traffic crashes injured more than 2.7 million people and killed more than 38,824 in 2020. The latter figure makes motor vehicle accidents one of the most significant causes of death in the U.S., especially for young people.
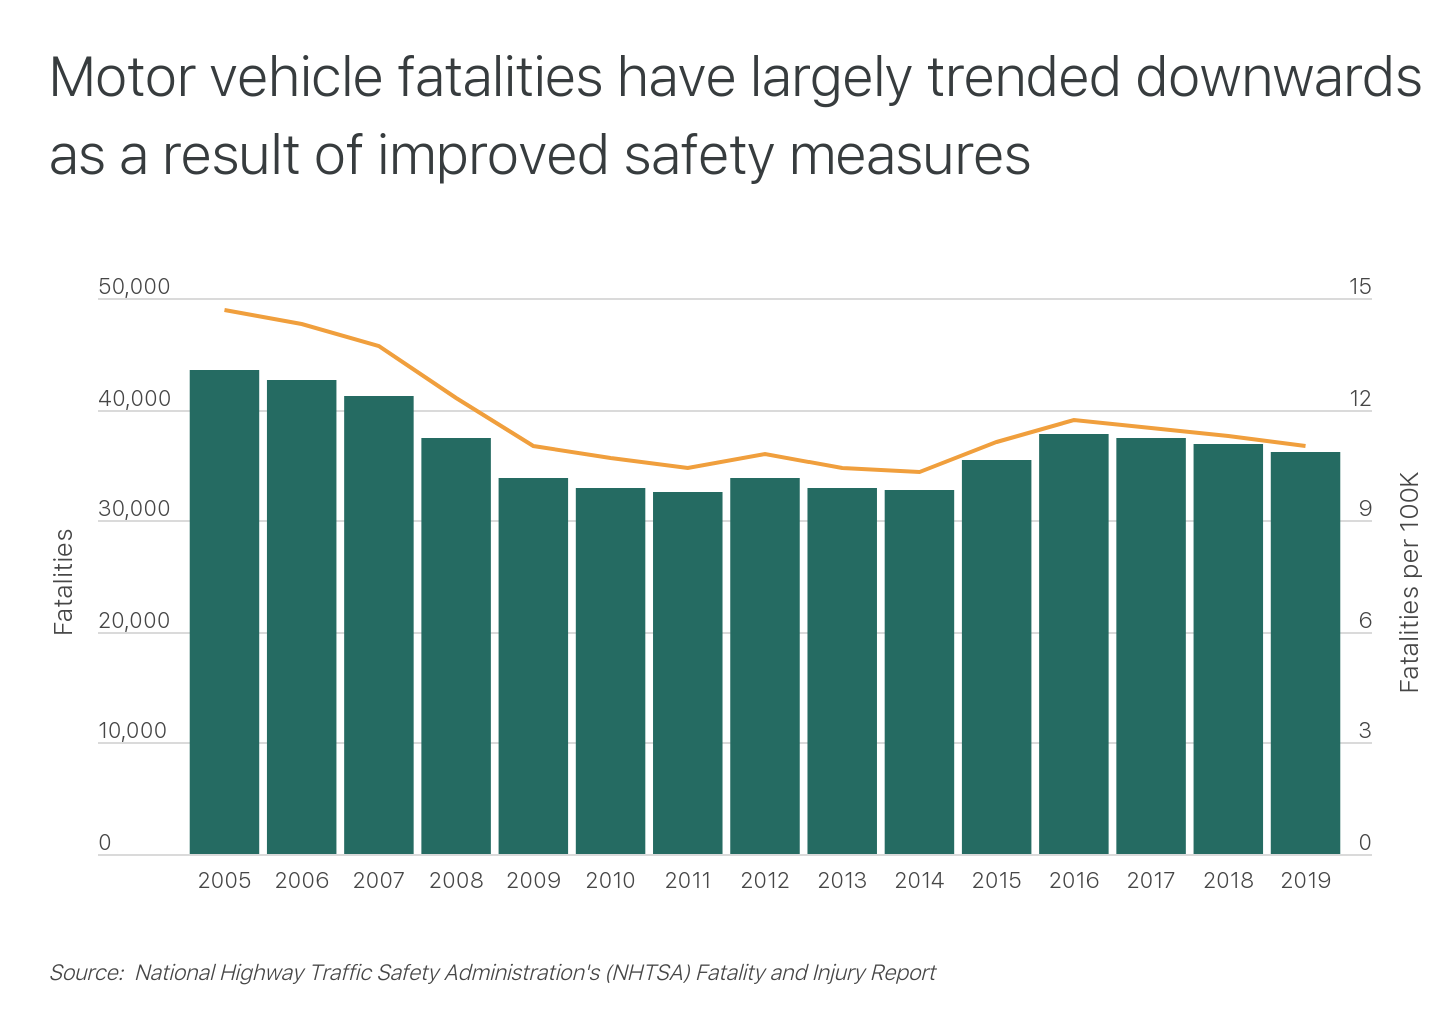
Fortunately, the overall trend in recent decades has been a reduction in fatalities, thanks to better vehicle safety and changes in public policy. Manufacturers have made vehicles safer with features like electronic stability control and automatic braking systems, which decrease the number of crashes, and improved airbags and collision technology, which make crashes less likely to be fatal. Meanwhile, states have sought to improve motorist safety with stricter laws on matters like seatbelts and the use of mobile devices while driving. Collectively, these changes have helped push the total number of motor vehicle fatalities down by more than 15 percent since 2005. When calculated relative to the U.S. population, motor fatalities are down 25 percent over the same span.
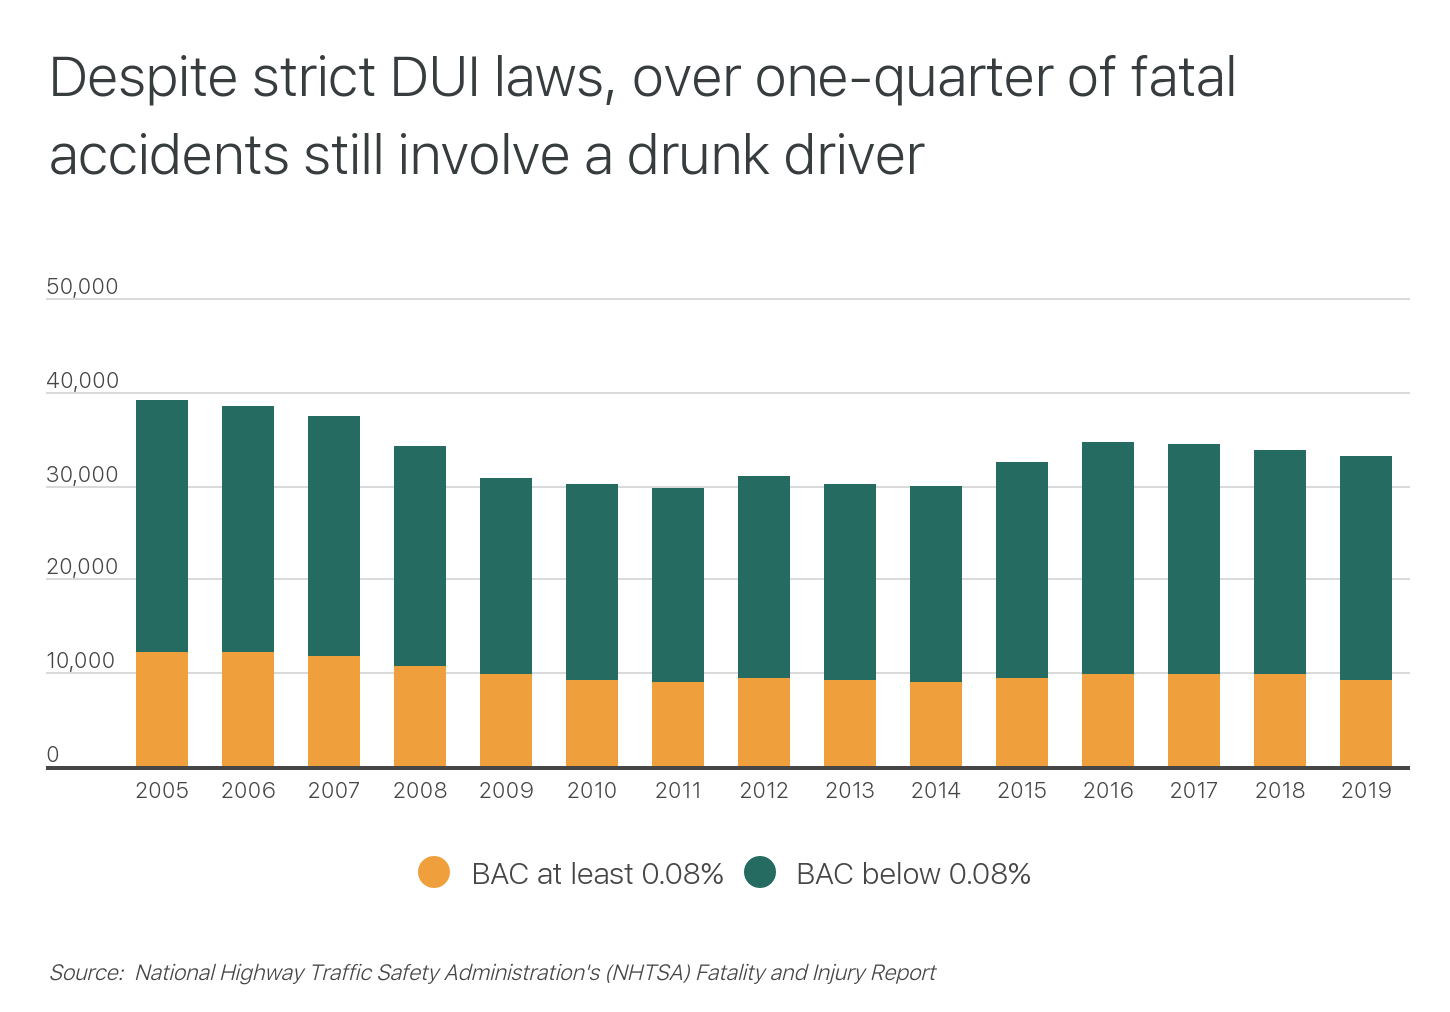
Efforts to improve safety laws have not been consistent across states, however, which has somewhat limited the progress that states have made in reducing fatalities. One major example is state law around drunk driving. The lenience of DUI laws varies from state to state, and in general, research shows that states with more lenient laws also tend to see higher rates of fatalities on the roads. In 2020, more than 9,000 fatal accidents involved a drunk driver, which accounted for 27.8 percent of fatalities that year.
TRENDING
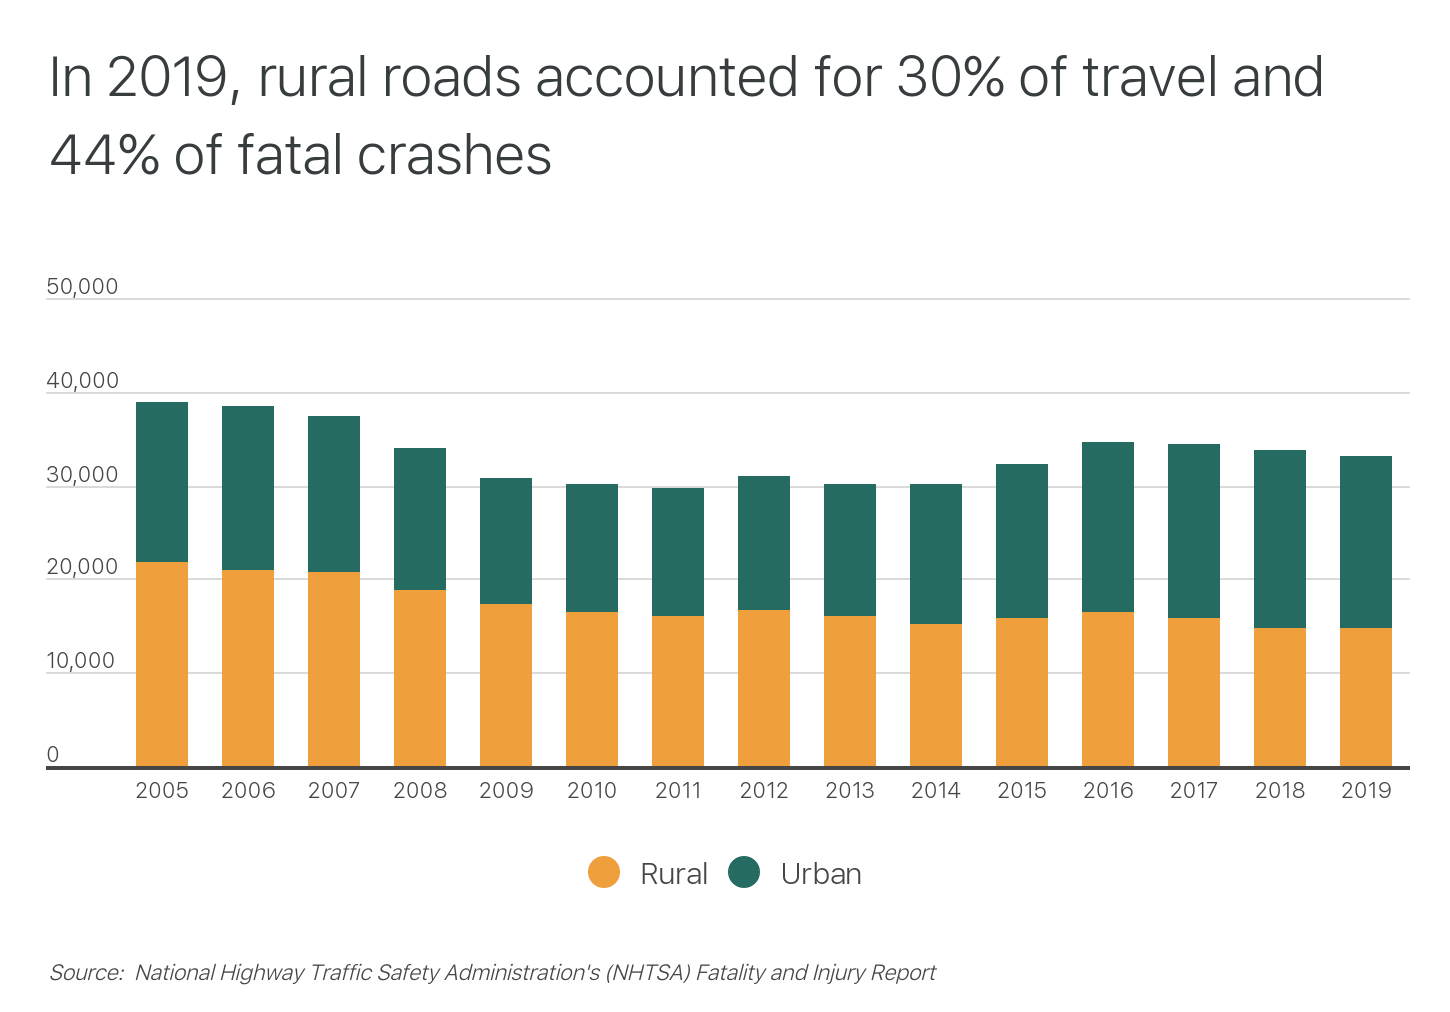
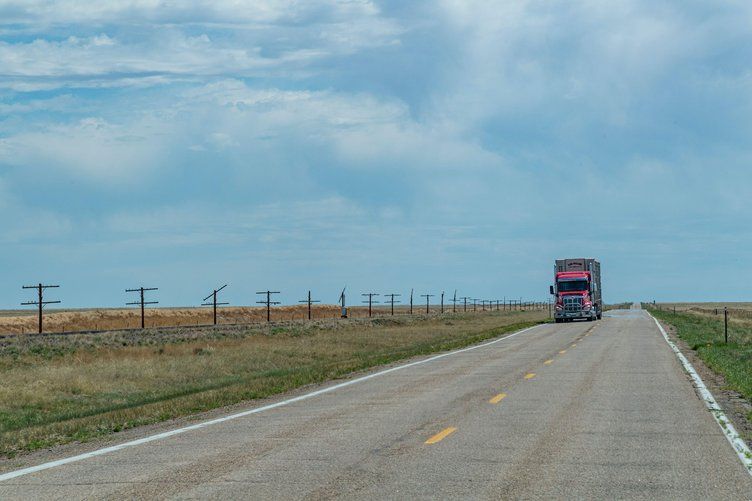
Another contributing factor to vehicle fatalities is the nature and safety of the roads people drive on. For example, rural roads tend to be narrower and less well-lit than their urban counterparts, which, among other factors, creates riskier driving conditions. As a result, rural roads accounted for the majority of vehicle fatalities up until 2015, and in more recent years, they still produce nearly half of all fatal crashes—while only representing around 30 percent of vehicle traffic. Traffic itself may also be a risk factor, as the lower number of drivers on rural roads produces a false sense of security, thereby increasing the incidence of unsafe behaviors like speeding or not wearing a seatbelt.
Given the variety of factors that can play into vehicle fatality rates, it should be no surprise that risks on the road vary by geography. To identify the locations where the risks are highest and lowest, researchers from Outdoorsy created a composite index of traffic safety indicators. These factors include each location’s collision likelihood relative to the U.S. average, the total motor vehicle fatalities per 100,000 people, and the percentage of fatal collisions involving a drunk driver.
Here are the cities with the most and least dangerous drivers.
The Top 10 Most Dangerous Cities for Driving

1. Dallas, TX
- Composite index: 88.48
- Average number of years between collisions: 7.2
- Relative collision likelihood: +46.5%
- Total motor vehicle fatalities per 100k: 14.3
- Share of fatal collisions involving a drunk driver: 42.4%
- Population: 1,343,565

2. Baton Rouge, LA
- Composite index: 85.60
- Average number of years between collisions: 6.8
- Relative collision likelihood: +55.1%
- Total motor vehicle fatalities per 100k: 21.9
- Share of fatal collisions involving a drunk driver: 27.7%
- Population: 220,248

3. San Bernardino, CA
- Composite index: 83.02
- Average number of years between collisions: 7.5
- Relative collision likelihood: +41.8%
- Total motor vehicle fatalities per 100k: 17.9
- Share of fatal collisions involving a drunk driver: 30.4%
- Population: 215,780
DID YOU KNOW?
San Diego was the most popular place for RV rentals in 2020. Check out our RV rental San Diego guide, and start planning your trip soon!
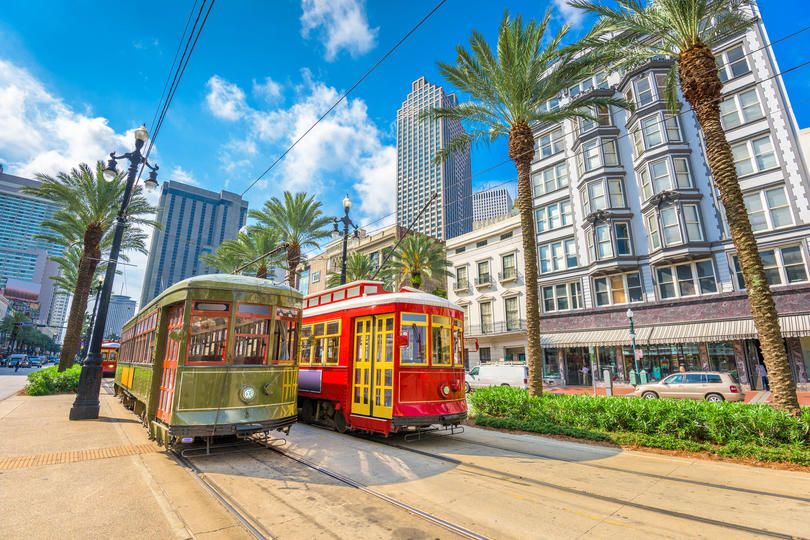
4. New Orleans, LA
- Composite index: 80.84
- Average number of years between collisions: 7.1
- Relative collision likelihood: +49.1%
- Total motor vehicle fatalities per 100k: 11.1
- Share of fatal collisions involving a drunk driver: 36.4%
- Population: 390,144
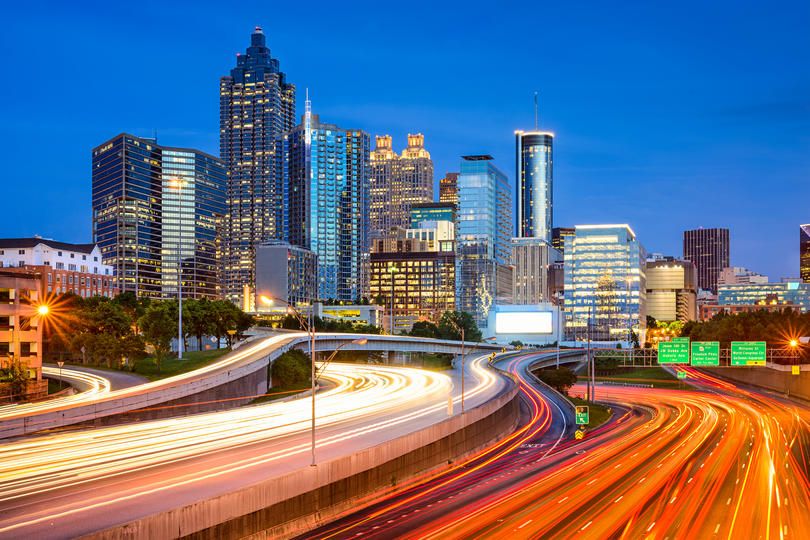
5. Atlanta, GA
- Composite index: 77.90
- Average number of years between collisions: 7.1
- Relative collision likelihood: +49.5%
- Total motor vehicle fatalities per 100k: 13.5
- Share of fatal collisions involving a drunk driver: 27.2%
- Population: 506,804
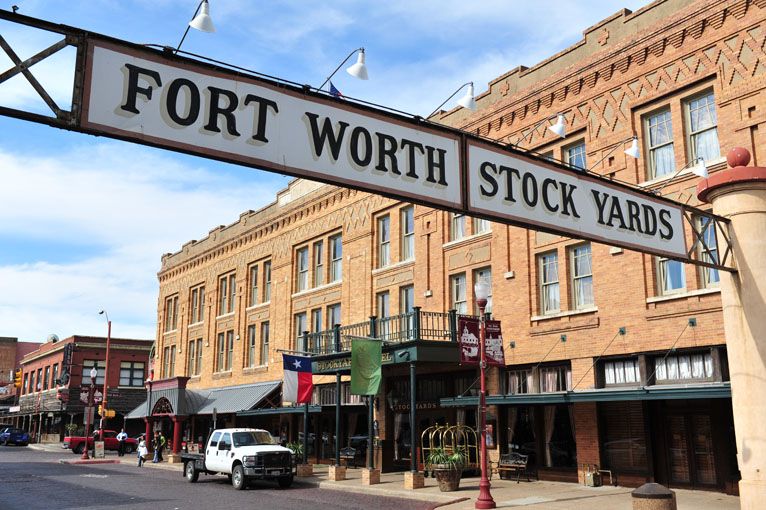
6. Fort Worth, TX
- Composite index: 77.84
- Average number of years between collisions: 8.2
- Relative collision likelihood: +29.7%
- Total motor vehicle fatalities per 100k: 11.5
- Share of fatal collisions involving a drunk driver: 43.3%
- Population: 913,656

7. Detroit, MI
- Composite index: 76.78
- Average number of years between collisions: 8.6
- Relative collision likelihood: +22.9%
- Total motor vehicle fatalities per 100k: 16.1
- Share of fatal collisions involving a drunk driver: 37.1%
- Population: 670,052
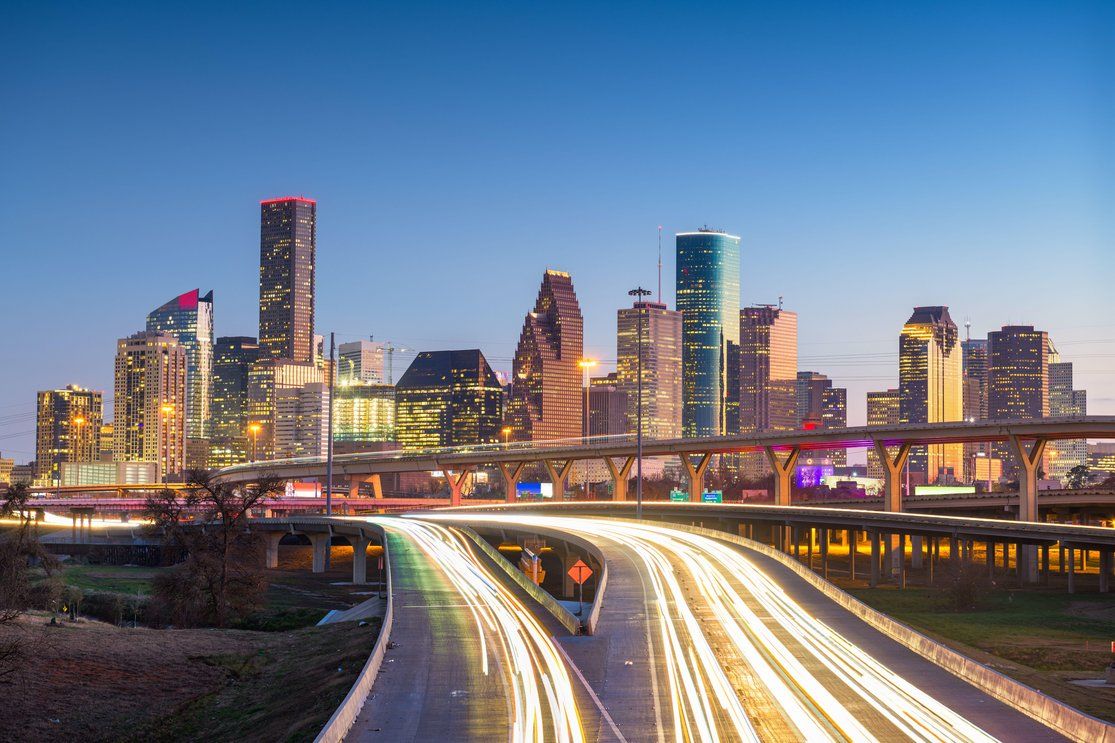
8. Houston, TX
- Composite index: 76.20
- Average number of years between collisions: 7.7
- Relative collision likelihood: +38.1%
- Total motor vehicle fatalities per 100k: 10.1
- Share of fatal collisions involving a drunk driver: 40.4%
- Population: 2,316,797

9. Cincinnati, OH
- Composite index: 75.52
- Average number of years between collisions: 7.2
- Relative collision likelihood: +47.6%
- Total motor vehicle fatalities per 100k: 8.7
- Share of fatal collisions involving a drunk driver: 37.5%
- Population: 303,954

10. Cleveland, OH
- Composite index: 73.04
- Average number of years between collisions: 8.9
- Relative collision likelihood: +19.0%
- Total motor vehicle fatalities per 100k: 12.3
- Share of fatal collisions involving a drunk driver: 42.1%
- Population: 380,989
The Top 10 Safest Cities for Driving

1. Cary, NC
- Composite index: 4.54
- Average number of years between collisions: 12.0
- Relative collision likelihood: -12.0%
- Total motor vehicle fatalities per 100k: 1.8
- Share of fatal collisions involving a drunk driver: 22.2%
- Population: 171,143
RELATED
Are you planning to go on a road trip soon? Read our detailed guide about the best RV parks in the country.
2. Overland Park, KS
- Composite index: 6.12
- Average number of years between collisions: 12.4
- Relative collision likelihood: -15.0%
- Total motor vehicle fatalities per 100k: 3.5
- Share of fatal collisions involving a drunk driver: 15.8%
- Population: 195,483

3. Gilbert, AZ
- Composite index: 12.26
- Average number of years between collisions: 10.8
- Relative collision likelihood: -1.6%
- Total motor vehicle fatalities per 100k: 3.1
- Share of fatal collisions involving a drunk driver: 21.7%
- Population: 254,115
4. Olathe, KS
- Composite index: 12.64
- Average number of years between collisions: 12.7
- Relative collision likelihood: -16.5%
- Total motor vehicle fatalities per 100k: 3.6
- Share of fatal collisions involving a drunk driver: 26.7%
- Population: 140,557
5. Oxnard, CA
- Composite index: 12.74
- Average number of years between collisions: 10.1
- Relative collision likelihood: +4.3%
- Total motor vehicle fatalities per 100k: 2.9
- Share of fatal collisions involving a drunk driver: 5.9%
- Population: 208,875
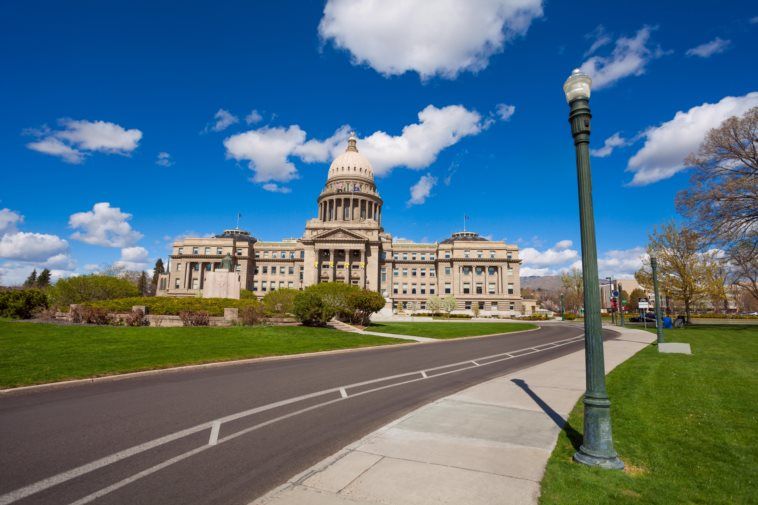
6. Boise, ID
- Composite index: 13.86
- Average number of years between collisions: 13.7
- Relative collision likelihood: -22.6%
- Total motor vehicle fatalities per 100k: 6.0
- Share of fatal collisions involving a drunk driver: 22.2%
- Population: 228,965
7. Naperville, IL
- Composite index: 14.72
- Average number of years between collisions: 9.8
- Relative collision likelihood: +8.5%
- Total motor vehicle fatalities per 100k: 1.8
- Share of fatal collisions involving a drunk driver: 0.0%
- Population: 149,640

8. Madison, WI
- Composite index: 15.24
- Average number of years between collisions: 12.2
- Relative collision likelihood: -13.2%
- Total motor vehicle fatalities per 100k: 3.0
- Share of fatal collisions involving a drunk driver: 30.0%
- Population: 259,673

9. Lincoln, NE
- Composite index: 22.30
- Average number of years between collisions: 11.5
- Relative collision likelihood: -7.7%
- Total motor vehicle fatalities per 100k: 4.2
- Share of fatal collisions involving a drunk driver: 31.4%
- Population: 289,096

10. Chandler, AZ
- Composite index: 24.48
- Average number of years between collisions: 11.2
- Relative collision likelihood: -5.7%
- Total motor vehicle fatalities per 100k: 6.1
- Share of fatal collisions involving a drunk driver: 26.7%
- Population: 261,149
Detailed Findings & Methodology
The data used in this analysis is from Allstate America’s Best Drivers Report 2019, the U.S. National Highway Traffic Safety Administration’s (NHTSA) Fatality Analysis Reporting System, and the U.S. Census Bureau’s 2019 American Community Survey. To determine the cities with the most and least dangerous drivers, researchers created a composite index based on the following factors:
- Relative collision likelihood (40% weight)
- Total motor vehicle fatalities per capita (40% weight)
- Share of fatal collisions involving a drunk drinker (20% weight)
In the event of a tie, the city with the greatest average number of years between collisions was ranked higher. Only the largest American cities with available data from all three data sources were included in the analysis.
!function(e,i,n,s){var t=”InfogramEmbeds”,d=e.getElementsByTagName(“script”)[0];if(window[t]&&window[t].initialized)window[t].process&&window[t].process();else if(!e.getElementById(n)){var o=e.createElement(“script”);o.async=1,o.id=n,o.src=”https://e.infogram.com/js/dist/embed-loader-min.js”,d.parentNode.insertBefore(o,d)}}(document,0,”infogram-async”);


